
Below is the breakdown for the Big Bear real estate market in 2008.
Big Bear Home Sales
As previous mentioned on this blog, the residential sales, or homes sales, made up a significant amount of the sales in 2008, nearly 85% of the total market.


| Year | # of Homes Sold | % Change | Median Sales Price | % Change | Average Sales Price | % Change | Days on Market | List Price to Sales Price |
|---|---|---|---|---|---|---|---|---|
| 2008 | 665 | -16% | $255,000 | -18% | $332,408 | -18% | 135 | 94% |
| 2007 | 786 | -32% | $310,000 | -3% | $403,812 | +1% | 124 | 95% |
| 2006 | 1155 | -36% | $319,500 | +10% | $400,232 | +12% | 83 | 97% |
| 2005 | 1802 | -7% | $290,000 | +23% | $355,918 | +29% | 68 | 98% |
| 2004 | 1905 | +16% | $235,000 | +25% | $276,716 | +21% | 76 | 98% |
| 2003 | 1646 | n/a | $188,000 | n/a | $228,284 | n/a | 41 | 98% |
Even though the number of homes sold in Big Bear was substantially less in 2008 than the numbers we saw back 2005, 2004, & 2003, the average & median price still remains higher than we were seeing in 2003 & 2004.
Big Bear Vacant Land Sales
Vacant land sales have also dropped off significantly. I was surprised to see the the average & median still increase in 2008. I would make sense that they would be dropping like the home prices.
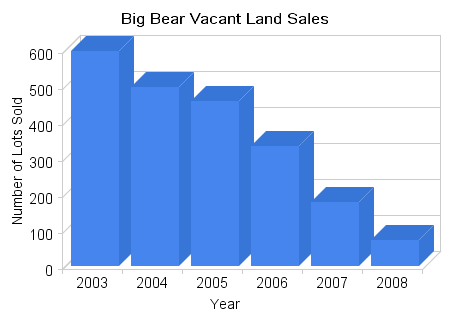
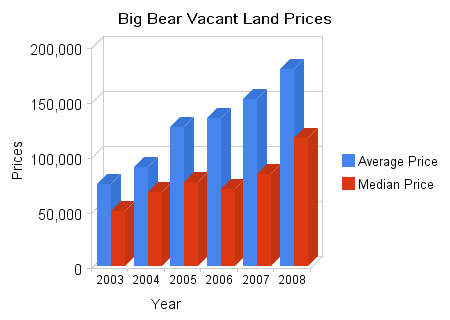
| Year | # of Vacant Lots Sold | % Change | Median Sales Price | % Change | Average Sales Price | % Change | Days on Market | List Price to Sales Price |
|---|---|---|---|---|---|---|---|---|
| 2008 | 71 | -61% | $116,000 | +38% | $179,184 | +17% | 119 | 83% |
| 2007 | 178 | -47% | $84,000 | +20% | $152,123 | +13% | 123 | 91% |
| 2006 | 333 | -29% | $70,000 | -9% | $134,630 | +6% | 77 | 95% |
| 2005 | 457 | -10% | $76,700 | +13% | $126,626 | +40% | 91 | 97% |
| 2004 | 498 | -18% | $67,700 | +35% | $90,060 | +20% | 117 | 94% |
| 2003 | 596 | n/a | $50,000 | n/a | $74,922 | n/a | 102 | 96% |
I definitely think we will see a price drop in 2009 as the demand for vacant land remains very weak. Just looking at the list price to sales price ratio in the chart above shows that the asking price and selling price for vacant land in Big Bear is nearly 20% different. Compare that to an only 6% difference for residential.
Big Bear Market (All Sales)
Rather than looking individually at the remainder of the market, which makes up a smaller section of the total market (condos, government lease property, commercial & residential investments, and business opportunities), here’s a look at the Big Bear real estate market as a whole.
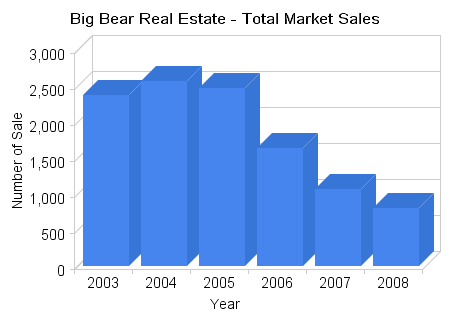
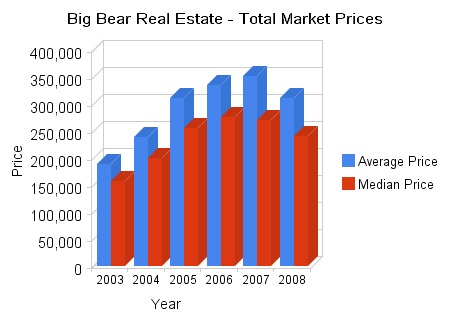
| Year | # of Properties Sold | % Change | Median Sales Price | % Change | Average Sales Price | % Change | Days on Market | List Price to Sales Price |
|---|---|---|---|---|---|---|---|---|
| 2008 | 802 | -27% | $240,000 | -11% | $311,904 | -12% | 141 | 93% |
| 2007 | 1070 | -35% | $270,000 | -2% | $351,906 | +5% | 126 | 94% |
| 2006 | 1644 | -33% | $275,000 | +8% | $335,120 | +7% | 82 | 96% |
| 2005 | 2468 | -4% | $255,000 | +28% | $311,850 | +30% | 75 | 98% |
| 2004 | 2571 | +8% | $199,900 | +27% | $239,642 | +27% | 85 | 97% |
| 2003 | 2379 | n/a | $157,000 | n/a | $188,881 | n/a | 71 | 97% |
And there it is.
Expect more of the same for 2009 as we get through this market dominated by tough financing, bank owned properties, and short sales.
Like what you are reading? Be sure to sign up for my email newsletter or RSS feed.
* Information courtesy of the Big Bear MLS. This information includes MLS data from areas including Big Bear Lake, Big Bear City, Moonridge, Fox Farm, Sugarloaf, Erwin Lake, Fawnskin & Baldwin Lake. It does not include data from areas in the Big Bear MLS that are located outside of the Big Bear area or data on properties in Big Bear that are listed in other MLS systems.


Speak Your Mind