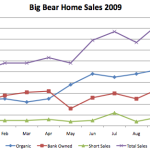
If you have not already been able to tell, I am a fan of charts and graphs as I think they give you a good visual of how the real estate market in Big Bear is performing. And, it was a quiet day today so I had some time to crunch the residential market stats for Big Bear this year. First off, home sales in Big Bear for 2009 through October. Some key takeaways - Bank owned properties dominated what was selling in the first quarter of the year, but have since dropped off When the total sales dropped, organic … [Read more...]
Vacant Land in Big Bear is Soooo 2003.
October 30, 2009 by Leave a Comment
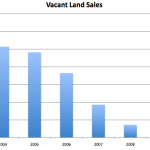
How hard is it to sell vacant land in today's real estate market in Big Bear? Take a look at the chart below... There's been a dramatic shift in the number of vacant land sales over the past several years. In 2003, our MLS recorded 602 total vacant land sales. '04 we had 514 vacant land sales. '05 we had 482. It wasn't until the turn of 2007 that we saw a dramatic drop in number of sales. We went from 365 total vacant land sales in 2006 to 186 in 2007. And to top it off, 2008 dropped sharply with only 72 … [Read more...]
Is The Big Bear Real Estate Market Headed Toward The Perfect Storm?
September 7, 2009 by 7 Comments

I believe it could be. The current state of the real estate market in Big Bear reminds me of a scene in the movie, "The Perfect Storm". Near the end of the movie, after the fishing boat and its crew battle huge waves and horrible weather, things clear up. They think they made it through. But, the storm comes right back even stronger and eventually sinks the ship & crew. This is similar to the current state of the real estate market in Bear. We've seen rough waters over the past 2-3 years, and things … [Read more...]
Big Bear Home Sales – August 2009
September 6, 2009 by 2 Comments

Big Bear Home Sales Big Bear home sales dropped in August from the 2-year high we saw in July. Home sales fell 14% when compared to the July numbers (75 v. 87), but were up 25% when compared to August 2008 (75 v. 60). Even with the drop in sales month over month, sales are still pretty strong all things considered. They are certainly not close to the sales numbers we saw 4-7 ago (averaging about 175 per month). It is typical to see sales pick up in the June to October time frames as that is our selling … [Read more...]
Big Bear Foreclosure Numbers – July 2009
August 22, 2009 by 2 Comments
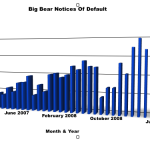
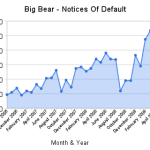
Foreclosure numbers in Big Bear are still on the rise. The foreclosure filings in July 2009 were up 16% from June 2009, and 81% from July 2008. Keep in mind, foreclosure filings are made up of Notices of Default, a recorded document that starts the foreclosure process, Notices of Sale, a recorded document that sets the date for the Trustee Sale, and lastly, Trustee Sales, properties that go back to the bank or sold to third parties. While the overall news on the real estate market may appear to be getting … [Read more...]
Big Bear Home Sales July 2009
August 9, 2009 by 2 Comments

Big Bear Home Sales Big Bear home sales hit a two year high in July 2009. Home sales rose 9% when compared to the June numbers (84 v. 77), and 35% when compared to June 2008 (84 v. 62). This is great news for the Big Bear real estate market as it is the second strong month for home sales. Even if prices are still a bit volatile, strong sales are always positive sign. It is important to keep in mind that in a normal market, sales should be in the range of 150-200 per month. We are still a long ways from that. 29, … [Read more...]
Big Bear Foreclosure Numbers – June 2009
August 6, 2009 by Leave a Comment
Sorry for being a little late with these. The number of Big Bear properties that went back to the bank (future bank owned listings) in June 2009 was an all time high at 52, 8 more than the previous high of 44 set in May. In total, the foreclosure filings for the month of June 2009 were down 2% from May 2009, but up 34% from the June 2008 numbers. Keep in mind, foreclosure filings are made up of Notices of Default, a recorded document that is the start of the foreclosure process, Notices of Sale, a recorded … [Read more...]
Big Bear Foreclosure Numbers – May 2009
June 28, 2009 by Leave a Comment
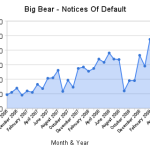
If the foreclosure market has anything to say about how long this down market will last, don't expect things to get better anytime soon. Foreclosure filings in Big Bear were up 20% in May 2009 compared to April 2009. And year over year, foreclosure filings were up 53% as compared to May 2008. Foreclosure filings, which are made up on Notices of Default (NOD), Notices of Trustee Sale (NTS), and Trustee Sales, are a good indicator of the future health of any real estate market. Accordingly, the real estate market … [Read more...]
Big Bear Real Estate Monday Market Update For 6/8/2009
June 8, 2009 by Leave a Comment
Below is your weekly update for the Big Bear real estate market as of 6/8/2009. Property Type Listings for Sale Change from Last Week Pending Sales Change from Last Week Sales Year to Date Change from Last Week RESIDENTIAL 898 -12 167 +3 300 +24 VACANT LAND 375 -1 15 +2 12 0 CONDOS 61 0 4 +1 10 0 GOVERNMENT LEASE 15 0 1 0 0 0 COMMERCIAL & RES INVESTMENT 61 0 3 0 8 0 BUSINESS OPPORTUNITY 13 0 0 0 1 0 TOTAL 1423 -13 190 +6 331 +24 These are the quick stats for the week - 36 new residential … [Read more...]
Recent Sales Numbers Around the Big Bear Valley Area
June 7, 2009 by Leave a Comment

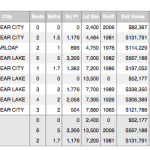
We're halfway through 2009 so I figured it would be helpful to give you an update on the activity over the first two quarters of the year. I've broken down some data for the different areas of Big Bear and here's what stands out in my opinion. Big Bear Lake Sales- 19 out of 57 buyers paid cash so far this year in Big Bear Lake. This includes Lakefront Sales. 19 were Bank Owned (REO) properties. Average Days on Market was 139. Average Price per Square Foot was $241.14/ft. As of today, there are 208 homes for … [Read more...]