Want to know some of the best properties in Big Bear to purchase this week? Simply click on the highlighted property to see the details of these "best in show" properties. Under $100K: 492 Santa Barbara: This is a quaint, charming property that sits on a 5,000 sq.ft nicely treed, corner fenced lot. It is also a Fannie Mae property that has extra incentives for primary, second home and investment purchasers. $100K-$200K: 300 Tiger Lily: This full log home sits on a roomy 5,000 sq. ft. lot with ski slopes … [Read more...]
Big Bear Real Estate Market Predictions 2011 for Buyers
January 15, 2011 by Leave a Comment

I specialize in working with real estate buyers in Big Bear Lake, CA where 2nd homes in a resort town makeup a majority of our market sales. This is an interesting article I came across with some insight of what we may expect for this 2011 real estate market. In the article, Tara-Nicholle Nelson has put this in four categories. 1. Prices and mortgage rates will stay low in most areas. This is good news for Buyers! This formula is perfect for the lowest monthly payment and will help Buyers have a chance to get … [Read more...]
Big Bear Home Sales – November 2010
December 11, 2010 by Leave a Comment
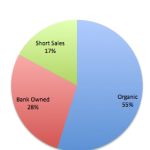
Big Bear home sales hit their highest mark this year with a total of 93 sales in November. The median sales price rose considerably, up 32% from October, while average sales price remained stable. Big Bear Home Sales Home sales in November (93) were up 18% when compared to the October sales (79). Year over year, sales were up just 2% from November 2009 (91). 26, or 28%, of the 93 sales were bank owned, down 12% from last month. 16 of the sales, or 17%, were short sales, which is 8% more than last month and the … [Read more...]
Big Bear Foreclosure Numbers – October 2010
November 22, 2010 by Leave a Comment
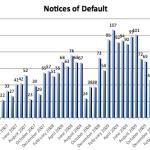
Foreclosure filings for Big Bear dropped in October 2010, down 17% when compared to September, a sizable chunk which continues the zig-zag movement of the Big Bear foreclosure market over the past year. Year over year, foreclosure filings were down 33% from the October 2009 numbers, the tenth straight month that foreclosure filings were down year over year. Foreclosure filings are made up of three parts - Notices of Default (NOD), a recorded document that starts the foreclosure process, which is normally filed … [Read more...]
Big Bear Home Sales – October 2010
November 15, 2010 by Leave a Comment
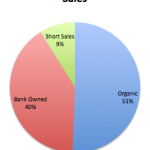
Home sales in Big Bear dropped 6% in October 2010. The median sales price dropped considerably, down 12%, while average sales price dropped 16% in October. Big Bear Home Sales Home sales in October (79) were down when compared to the September sales (84). Year over year, sales were down 17% from October 2009 (94). 32, or 40%, of the 79 sales were bank owned, up 11% from last month and more in line with what we've been used to seeing. 7 of the sales, or 9%, were short sales, which is 1% more than last … [Read more...]
Big Bear Foreclosure Numbers – September 2010
October 20, 2010 by 1 Comment
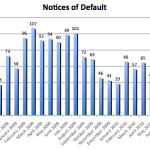
Foreclosure filings in Big Bear dropped in September 2010, down 3% when compared to August, thus again showing the zig-zag movement of the Big Bear foreclosure market. Year over year, foreclosure filings were down 11% from the September 2009 numbers, the ninth straight month that foreclosure filings were down year over year. Foreclosure filings are made up of three parts - Notices of Default (NOD), a recorded document that starts the foreclosure process, which is normally filed after homeowners fall behind in … [Read more...]
Big Bear Home Sales – September 2010 & Third Quarter 2010
October 10, 2010 by Leave a Comment
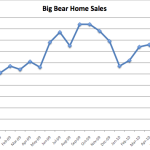
Home sales in Big Bear rose 20% in September 2010 while the median sales price remained relatively the same, up just 1%. The average sales price was up 3% in September. Big Bear Home Sales Home sales in September (84) were up when compared to the August sales (70). Year over year however, sales were down 12% from September 2009 (95). 24, or 29%, of the 84 sales were bank owned, the same % as last month. This is the second straight month that bank owned sales have made up a lower than average showing. The … [Read more...]
Big Bear Foreclosure Numbers – August 2010
September 18, 2010 by Leave a Comment
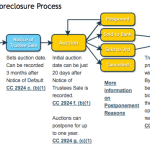
Foreclosure filings in Big Bear rose back up in August 2010, up 5% when compared to July, continuing the zig-zag movement of the Big Bear foreclosure market. Year over year, foreclosure filings were down 25% from the August 2009 numbers, the eighth straight month that foreclosure filings were down year over year. Keep in mind, foreclosure filings are made up of three parts - Notices of Default (NOD), a recorded document that starts the foreclosure process, which is normally filed after homeowners fall behind in … [Read more...]
Big Bear Home Sales – August 2010
September 7, 2010 by Leave a Comment
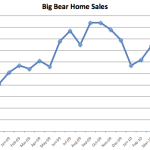
August home sales in Big Bear remained flat while the median sales price showed a slight drop, and the average sales price rose moderately. Big Bear Home Sales Home sales in August (68) were level when compared to the July sales (68). Year over year however, sales were down 9% from August 2009 (75). 20, or 29%, of the 68 sales were bank owned, 7% less than last month. This is one of the lowest months for bank owned sales that we've seen in some time. The monthly average is normally in 40-50% range. 7 of the … [Read more...]
Big Bear Foreclosure Numbers – July 2010
August 16, 2010 by Leave a Comment
Foreclosure filings in Big Bear dropped in July 2010, down 5% when compared to June, continuing the zig-zag uncertainty of the Big Bear foreclosure market. Year over year, foreclosure filings were down 14% from the July 2009 numbers, the seventh straight month that foreclosure filings were down year over year. Notices of sale saw a decent size drop while notices of default were down slightly. The number of properties going back to the bank in July came back up, but it was still on the lower end of the monthly … [Read more...]